안녕하세요.
오늘은 Juniper srx ip monitor에 대해서 알아보겠습니다.
시스코 용어로는 IP SLA입니다.
아래처럼 SRX에 인터넷이 2개 연결되었다고 확인해보겠습니다.
Default Gateway는 한개만 선택되어서 라이팅이 됩니다.
Main Internet를 통해서 google 8.8.8.8를 모니터링하고 있다가, Main Internet이 죽으면 자동으로
디폴트케이트웨이를 백업 인터넷으로 변경을 실습해 보겠습니다.
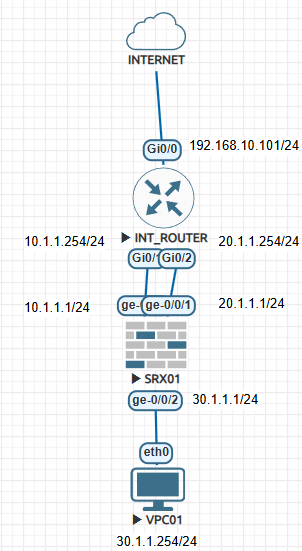
토폴로지는 아래와 같습니다.
SRX
Ge-0/0/0 10.1.1.1이 메인 Internet
Ge-0/0/1 20.1.1.1이 백업 Internet 으로 간주하겠습니다.
Internet 라우터는 SRX에 올라오는 트래픽을 NAT처리해서 8.8.8.8이랑 통신 되게 설정 합니다.
기본설정을 먼저 해보겠습니다.
INTENRET ROUTER 설정 입니다.
| Router(config)#no ip domain-lookup Router(config)#hostname INT_ROUTER INT_ROUTER(config)#line con 0 INT_ROUTER(config-line)#exec-time INT_ROUTER(config-line)#logg sy INT_ROUTER(config-line)#end INT_ROUTER#conf t INT_ROUTER(config)#int g0/0 INT_ROUTER(config-if)#ip add 192.168.10.101 255.255.255.0 INT_ROUTER(config-if)#no sh INT_ROUTER(config-if)#end INT_ROUTER(config)#int g0/1 INT_ROUTER(config-if)#ip add 10.1.1.254 255.255.255.0 INT_ROUTER(config-if)#no sh INT_ROUTER(config-if)#int g0/2 \INT_ROUTER(config-if)#ip add 20.1.1.254 255.255.255.0 INT_ROUTER(config-if)#no sh INT_ROUTER(config-if)#end INT_ROUTER(config)#ip route 0.0.0.0 0.0.0.0 192.168.10.253 INT_ROUTER(config)#end INT_ROUTER# INT_ROUTER# INT_ROUTER#show ip int brie Interface IP-Address OK? Method Status Protocol GigabitEthernet0/0 192.168.10.101 YES manual up up GigabitEthernet0/1 10.1.1.254 YES manual up up GigabitEthernet0/2 20.1.1.254 YES manual up up GigabitEthernet0/3 unassigned YES unset administratively down down INT_ROUTER# INT_ROUTER#ping 8.8.8.8 Type escape sequence to abort. Sending 5, 100-byte ICMP Echos to 8.8.8.8, timeout is 2 seconds: !!!!! Success rate is 100 percent (5/5), round-trip min/avg/max = 2/3/6 ms |
PAT를 설정 합니다.
| INT_ROUTER#conf t INT_ROUTER(config)#int g0/0 INT_ROUTER(config-if)#ip nat outside INT_ROUTER(config-if)#int g0/1 INT_ROUTER(config-if)#ip nat inside INT_ROUTER(config-if)#int g0/2 INT_ROUTER(config-if)#ip nat inside INT_ROUTER(config-if)#end INT_ROUTER(config)#access-list 1 permit any INT_ROUTER(config)#ip nat inside source list 1 interface gigabitEthernet 0/0 overload INT_ROUTER#ping 8.8.8.8 Type escape sequence to abort. Sending 5, 100-byte ICMP Echos to 8.8.8.8, timeout is 2 seconds: !!!!! Success rate is 100 percent (5/5), round-trip min/avg/max = 4/5/7 ms INT_ROUTER#ping 8.8.8.8 source g0/1 Type escape sequence to abort. Sending 5, 100-byte ICMP Echos to 8.8.8.8, timeout is 2 seconds: Packet sent with a source address of 10.1.1.254 !!!!! Success rate is 100 percent (5/5), round-trip min/avg/max = 2/3/5 ms INT_ROUTER#ping 8.8.8.8 source g0/2 Type escape sequence to abort. Sending 5, 100-byte ICMP Echos to 8.8.8.8, timeout is 2 seconds: Packet sent with a source address of 20.1.1.254 !!!!! Success rate is 100 percent (5/5), round-trip min/avg/max = 3/5/8 ms INT_ROUTER# |
이번에는 주니퍼 기본 설정을 하겠습니다.
기본적으로 설정값을 다 지우고 root password를 설정 합니다.
| FreeBSD/amd64 (Amnesiac) (ttyu0) login: root --- JUNOS 21.3R1.9 Kernel 64-bit XEN JNPR-12.1-20210828.6e5b1bf_buil root@:~ # cli root> root> configure Entering configuration mode [edit] root# [edit] root# [edit] root# delete This will delete the entire configuration Delete everything under this level? [yes,no] (no) yes root# set system root-authentication plain-text-password New password: Retype new password: [edit] root# commit |
Interface 설정
| root> show configuration | display set | no-more set version 21.3R1.9 set system root-authentication encrypted-password "$6$6IWgKM8j$c5/l5czscFh31rD/X/mx8ug3IUwUdyYtb8/KYEjYA7J6YxayiDelNUx9cmSFxzjWpf/0LLxBAADLf.WGE2.XV1" set security zones security-zone trust host-inbound-traffic system-services all set security zones security-zone trust host-inbound-traffic protocols all set security zones security-zone trust interfaces ge-0/0/2.0 set security zones security-zone untrust host-inbound-traffic system-services all set security zones security-zone untrust host-inbound-traffic protocols all set security zones security-zone untrust interfaces ge-0/0/0.0 set security zones security-zone untrust interfaces ge-0/0/1.0 set interfaces ge-0/0/0 unit 0 family inet address 10.1.1.1/24 set interfaces ge-0/0/1 unit 0 family inet address 20.1.1.1/24 set interfaces ge-0/0/2 unit 0 family inet address 30.1.1.1/24 set protocols lldp interface all set routing-options static route 0.0.0.0/0 next-hop 10.1.1.254 |
| root> show interfaces terse Interface Admin Link Proto Local Remote ge-0/0/0 up up ge-0/0/0.0 up up inet 10.1.1.1/24 gr-0/0/0 up up ip-0/0/0 up up lsq-0/0/0 up up lt-0/0/0 up up mt-0/0/0 up up sp-0/0/0 up up sp-0/0/0.0 up up inet inet6 sp-0/0/0.16383 up up inet ge-0/0/1 up up ge-0/0/1.0 up up inet 20.1.1.1/24 ge-0/0/2 up up ge-0/0/2.0 up up inet 30.1.1.1/24 dsc up up fti0 up up fxp0 up up gre up up ipip up up irb up up lo0 up up lo0.16384 up up inet 127.0.0.1 --> 0/0 lo0.16385 up up inet 10.0.0.1 --> 0/0 10.0.0.16 --> 0/0 128.0.0.1 --> 0/0 128.0.0.4 --> 0/0 128.0.1.16 --> 0/0 lo0.32768 up up lsi up up mtun up up pimd up up pime up up pp0 up up ppd0 up up ppe0 up up st0 up up tap up up vlan up down root> show security zones Security zone: trust Zone ID: 7 Send reset for non-SYN session TCP packets: Off Policy configurable: Yes Interfaces bound: 2 Interfaces: ge-0/0/1.0 ge-0/0/2.0 Advanced-connection-tracking timeout: 1800 Unidirectional-session-refreshing: No Security zone: untrust Zone ID: 8 Send reset for non-SYN session TCP packets: Off Policy configurable: Yes Interfaces bound: 1 Interfaces: ge-0/0/0.0 Advanced-connection-tracking timeout: 1800 Unidirectional-session-refreshing: No Security zone: junos-host Zone ID: 2 Send reset for non-SYN session TCP packets: Off Policy configurable: Yes Interfaces bound: 0 Interfaces: Advanced-connection-tracking timeout: 1800 Unidirectional-session-refreshing: No root> root> ping 10.1.1.254 PING 10.1.1.254 (10.1.1.254): 56 data bytes 64 bytes from 10.1.1.254: icmp_seq=0 ttl=255 time=3.320 ms 64 bytes from 10.1.1.254: icmp_seq=1 ttl=255 time=3.150 ms 64 bytes from 10.1.1.254: icmp_seq=2 ttl=255 time=2.836 ms 64 bytes from 10.1.1.254: icmp_seq=3 ttl=255 time=2.550 ms 64 bytes from 10.1.1.254: icmp_seq=4 ttl=255 time=2.607 ms ^C --- 10.1.1.254 ping statistics --- 5 packets transmitted, 5 packets received, 0% packet loss round-trip min/avg/max/stddev = 2.550/2.893/3.320/0.300 ms root> ping 20.1.1.254 PING 20.1.1.254 (20.1.1.254): 56 data bytes 64 bytes from 20.1.1.254: icmp_seq=0 ttl=255 time=2.894 ms 64 bytes from 20.1.1.254: icmp_seq=1 ttl=255 time=2.782 ms 64 bytes from 20.1.1.254: icmp_seq=2 ttl=255 time=2.699 ms 64 bytes from 20.1.1.254: icmp_seq=3 ttl=255 time=3.372 ms 64 bytes from 20.1.1.254: icmp_seq=4 ttl=255 time=2.571 ms ^C --- 20.1.1.254 ping statistics --- 5 packets transmitted, 5 packets received, 0% packet loss round-trip min/avg/max/stddev = 2.571/2.864/3.372/0.275 ms root> |
NAT 설정
Source IP가 30.1.1.0/24에 대해서는 Source NAT를 진행합니다.
| set security nat source rule-set SOURCE-NAT from zone trust set security nat source rule-set SOURCE-NAT to zone untrust set security nat source rule-set SOURCE-NAT rule PAT-INTERFACE match source-address 30.1.1.0/24 set security nat source rule-set SOURCE-NAT rule PAT-INTERFACE match destination-address 0.0.0.0/0 set security nat source rule-set SOURCE-NAT rule PAT-INTERFACE then source-nat interface |
Firewall Rule 설정
| set security policies from-zone trust to-zone untrust policy trust_to_untrust match source-address any set security policies from-zone trust to-zone untrust policy trust_to_untrust match destination-address any set security policies from-zone trust to-zone untrust policy trust_to_untrust match application any set security policies from-zone trust to-zone untrust policy trust_to_untrust then permit |
VPC IP 설정 및 8.8.8.8 테스트
| VPCS> ip 30.1.1.254/24 30.1.1.1 Checking for duplicate address... VPCS : 30.1.1.254 255.255.255.0 gateway 30.1.1.1 VPCS> save Saving startup configuration to startup.vpc . done VPCS> ping 8.8.8.8 84 bytes from 8.8.8.8 icmp_seq=1 ttl=115 time=17.295 ms 84 bytes from 8.8.8.8 icmp_seq=2 ttl=115 time=4.437 ms 84 bytes from 8.8.8.8 icmp_seq=3 ttl=115 time=5.881 ms 84 bytes from 8.8.8.8 icmp_seq=4 ttl=115 time=5.225 ms ^C VPCS> VPCS> trace 8.8.8.8 trace to 8.8.8.8, 8 hops max, press Ctrl+C to stop 1 30.1.1.1 9.255 ms 0.759 ms 0.866 ms 2 10.1.1.254 8.273 ms 16.840 ms 4.871 ms 3 192.168.10.253 15.513 ms 4.014 ms 4.634 ms 4 202.14.11.193 3.964 ms 4.513 ms 3.862 ms 5 202.14.12.33 4.422 ms 3.900 ms 6.111 ms 6 203.117.190.81 7.847 ms 7.067 ms 9.060 ms ^C 7 * VPCS> |
위에 처럼 메인 Internet를 통해서 8.8.8.8 통신을 시도 합니다.
10.1.1.254 Main Internet
20.1.1.254 Backup Internet
SRX에서 IP MONITOR기능을 설정해서 Main Internet를 통해서 8.8.8.8 모니터링 합니다.
모니터링이 성공하면 디폴트로 설정된 Default Gateway를 사용하고 실패하면 20.1.1.254 Default Gateway를 추가하여.
우선순위를 더 높에 사용해서 20.1.1.254가 선택되게 합니다.
다시 Main Internet를 통해서 8.8.8.8 성공하면 Main Internet 10.1.1.254 Defualt Gateway가 선택 되게 합니다.
SRX 설정값 입니다.
| set services rpm probe probe-test test test probe-type icmp-ping set services rpm probe probe-test test test target address 8.8.8.8 set services rpm probe probe-test test test probe-count 5 set services rpm probe probe-test test test probe-interval 5 set services rpm probe probe-test test test test-interval 5 set services rpm probe probe-test test test thresholds successive-loss 10 set services rpm probe probe-test test test next-hop 10.1.1.254 set services ip-monitoring policy probe-policy match rpm-probe probe-test set services ip-monitoring policy probe-policy then preferred-route route 0.0.0.0/0 next-hop 20.1.1.254 |
라우팅을 확인 합니다
10.1.1.254가 사용중입니다.
| root> show route inet.0: 7 destinations, 7 routes (7 active, 0 holddown, 0 hidden) + = Active Route, - = Last Active, * = Both 0.0.0.0/0 *[Static/5] 00:37:58 > to 10.1.1.254 via ge-0/0/0.0 10.1.1.0/24 *[Direct/0] 00:37:58 > via ge-0/0/0.0 10.1.1.1/32 *[Local/0] 00:37:58 Local via ge-0/0/0.0 20.1.1.0/24 *[Direct/0] 00:37:58 > via ge-0/0/1.0 20.1.1.1/32 *[Local/0] 00:37:58 Local via ge-0/0/1.0 30.1.1.0/24 *[Direct/0] 00:37:58 > via ge-0/0/2.0 30.1.1.1/32 *[Local/0] 00:37:58 Local via ge-0/0/2.0 inet6.0: 1 destinations, 1 routes (1 active, 0 holddown, 0 hidden) + = Active Route, - = Last Active, * = Both ff02::2/128 *[INET6/0] 00:57:56 MultiRecv root> |
IP Monitering 상태 확인하는 방법
| root> show services rpm probe-results Owner: probe-test, Test: test Target address: 8.8.8.8, Probe type: icmp-ping, Icmp-id: 10, Test size: 5 probes Probe results: Response received Probe sent time: Thu Feb 6 13:11:33 2025 Probe rcvd/timeout time: Thu Feb 6 13:11:33 2025, No hardware timestamps Rtt: 3555 usec, Round trip jitter: 285 usec Round trip interarrival jitter: 1223 usec Results over current test: Probes sent: 5, Probes received: 5, Loss percentage: 0.000000 Measurement: Round trip time Samples: 5, Minimum: 3065 usec, Maximum: 3555 usec, Average: 3297 usec, Peak to peak: 490 usec, Stddev: 158 usec, Sum: 16484 usec Measurement: Positive round trip jitter Samples: 4, Minimum: 90 usec, Maximum: 285 usec, Average: 187 usec, Peak to peak: 195 usec, Stddev: 70 usec, Sum: 749 usec Measurement: Negative round trip jitter Samples: 1, Minimum: 277 usec, Maximum: 277 usec, Average: 277 usec, Peak to peak: 0 usec, Stddev: 0 usec, Sum: 277 usec Results over last test: Probes sent: 5, Probes received: 5, Loss percentage: 0.000000 Test completed on Thu Feb 6 13:11:33 2025 Measurement: Round trip time Samples: 5, Minimum: 3065 usec, Maximum: 3555 usec, Average: 3297 usec, Peak to peak: 490 usec, Stddev: 158 usec, Sum: 16484 usec Measurement: Positive round trip jitter Samples: 4, Minimum: 90 usec, Maximum: 285 usec, Average: 187 usec, Peak to peak: 195 usec, Stddev: 70 usec, Sum: 749 usec Measurement: Negative round trip jitter Samples: 1, Minimum: 277 usec, Maximum: 277 usec, Average: 277 usec, Peak to peak: 0 usec, Stddev: 0 usec, Sum: 277 usec Results over all tests: Probes sent: 10, Probes received: 10, Loss percentage: 0.000000 Measurement: Round trip time Samples: 10, Minimum: 3033 usec, Maximum: 13877 usec, Average: 5128 usec, Peak to peak: 10844 usec, Stddev: 3872 usec, Sum: 51275 usec Measurement: Positive round trip jitter Samples: 6, Minimum: 32 usec, Maximum: 8668 usec, Average: 1575 usec, Peak to peak: 8636 usec, Stddev: 3173 usec, Sum: 9449 usec Measurement: Negative round trip jitter Samples: 3, Minimum: 277 usec, Maximum: 10844 usec, Average: 6590 usec, Peak to peak: 10567 usec, Stddev: 4553 usec, Sum: 19771 usec root> |
아래처럼 8.8.8.8 모니터링이 성공하였다고 PASS 표시됩니다.
| root> show services ip-monitoring status Policy - probe-policy (Status: PASS) RPM Probes: Probe name Test Name Address Status ---------------------- --------------- ---------------- --------- probe-test test 8.8.8.8 PASS Route-Action (Adding backup routes when FAIL): route-instance route next-hop state ----------------- ----------------- ---------------- ------------- inet.0 0.0.0.0/0 20.1.1.254 NOT-APPLIED root> |
이번에는 INT_ROUTER에서 G0/1 Shutdown 해 보겠습니다.
| INT_ROUTER#show ip int brie Interface IP-Address OK? Method Status Protocol GigabitEthernet0/0 192.168.10.101 YES manual up up GigabitEthernet0/1 10.1.1.254 YES manual up up GigabitEthernet0/2 20.1.1.254 YES manual up up GigabitEthernet0/3 unassigned YES unset administratively down down NVI0 192.168.10.101 YES unset up up INT_ROUTER# INT_ROUTER#conf t Enter configuration commands, one per line. End with CNTL/Z. INT_ROUTER(config)#int g0/1 INT_ROUTER(config-if)#sh INT_ROUTER(config-if)# |
그리고 Juniper SRX에서 상태를 확인해 보겠습니다.
메인 Internet를 통해서 8.8.8.8 실패해서 FAIL이라고 표시 됩니다.
| root> show services ip-monitoring status Policy - probe-policy (Status: FAIL) RPM Probes: Probe name Test Name Address Status ---------------------- --------------- ---------------- --------- probe-test test 8.8.8.8 FAIL Route-Action (Adding backup routes when FAIL): route-instance route next-hop state ----------------- ----------------- ---------------- ------------- inet.0 0.0.0.0/0 20.1.1.254 APPLIED root> |
라우팅 테이블을 확인해보겠습니다.
0.0.0.0/0 * 20.1.1.254선택 되었습니다.
| root> show route inet.0: 7 destinations, 8 routes (7 active, 0 holddown, 0 hidden) + = Active Route, - = Last Active, * = Both 0.0.0.0/0 *[Static/1] 00:00:40, metric2 0 > to 20.1.1.254 via ge-0/0/1.0 [Static/5] 00:41:30 > to 10.1.1.254 via ge-0/0/0.0 10.1.1.0/24 *[Direct/0] 00:41:30 > via ge-0/0/0.0 10.1.1.1/32 *[Local/0] 00:41:30 Local via ge-0/0/0.0 20.1.1.0/24 *[Direct/0] 00:41:30 > via ge-0/0/1.0 20.1.1.1/32 *[Local/0] 00:41:30 Local via ge-0/0/1.0 30.1.1.0/24 *[Direct/0] 00:41:30 > via ge-0/0/2.0 30.1.1.1/32 *[Local/0] 00:41:30 Local via ge-0/0/2.0 inet6.0: 1 destinations, 1 routes (1 active, 0 holddown, 0 hidden) + = Active Route, - = Last Active, * = Both ff02::2/128 *[INET6/0] 01:01:28 MultiRecv root> |
PC에서 8.8.8.8 Ping확인
| VPCS> ping 8.8.8.8 84 bytes from 8.8.8.8 icmp_seq=1 ttl=115 time=14.530 ms 84 bytes from 8.8.8.8 icmp_seq=2 ttl=115 time=6.496 ms 84 bytes from 8.8.8.8 icmp_seq=3 ttl=115 time=4.036 ms 84 bytes from 8.8.8.8 icmp_seq=4 ttl=115 time=4.639 ms ^C VPCS> trace 8.8.8.8 trace to 8.8.8.8, 8 hops max, press Ctrl+C to stop 1 30.1.1.1 6.549 ms 0.323 ms 0.288 ms 2 20.1.1.254 4.672 ms 2.443 ms 2.587 ms 3 192.168.10.253 5.439 ms 3.019 ms 3.723 ms 4 202.14.11.193 2.668 ms 3.153 ms 2.520 ms 5 202.14.12.33 3.274 ms 2.983 ms 3.199 ms 6 203.117.190.81 3.344 ms 2.981 ms 3.447 ms 7 * * * 8 203.116.3.50 4.120 ms 3.835 ms 3.361 ms VPCS> |
Backup Internet 20.1.1.254를 통해서 8.8.8.8 통신 되었습니다.
이번에는 다시 INT_ROUTER G0/1를 Shutdown해서 Main Internet를 살리겠습니다
| INT_ROUTER#conf t Enter configuration commands, one per line. End with CNTL/Z. INT_ROUTER(config)#int g0/1 INT_ROUTER(config-if)#no sh INT_ROUTER(config-if)#end INT_ROUTER# |
Juniper SRX에 확인해보겠습니다.
메인 Intenret를 통해서 8.8.8.8 성공해서 PASS라고 표시 됩니다.
| root> show services ip-monitoring status Policy - probe-policy (Status: PASS) RPM Probes: Probe name Test Name Address Status ---------------------- --------------- ---------------- --------- probe-test test 8.8.8.8 PASS Route-Action (Adding backup routes when FAIL): route-instance route next-hop state ----------------- ----------------- ---------------- ------------- inet.0 0.0.0.0/0 20.1.1.254 NOT-APPLIED |
라우팅 확인
메인 Intrenet이 0.0.0.0/0 선택 되었습니다.
| root> show route inet.0: 7 destinations, 7 routes (7 active, 0 holddown, 0 hidden) + = Active Route, - = Last Active, * = Both 0.0.0.0/0 *[Static/5] 00:44:58 > to 10.1.1.254 via ge-0/0/0.0 10.1.1.0/24 *[Direct/0] 00:44:58 > via ge-0/0/0.0 10.1.1.1/32 *[Local/0] 00:44:58 Local via ge-0/0/0.0 20.1.1.0/24 *[Direct/0] 00:44:58 > via ge-0/0/1.0 20.1.1.1/32 *[Local/0] 00:44:58 Local via ge-0/0/1.0 30.1.1.0/24 *[Direct/0] 00:44:58 > via ge-0/0/2.0 30.1.1.1/32 *[Local/0] 00:44:58 Local via ge-0/0/2.0 inet6.0: 1 destinations, 1 routes (1 active, 0 holddown, 0 hidden) + = Active Route, - = Last Active, * = Both ff02::2/128 *[INET6/0] 01:04:56 MultiRecv root> |
PC에서 Ping확인
| VPCS> ping 8.8.8.8 84 bytes from 8.8.8.8 icmp_seq=1 ttl=115 time=5.238 ms 84 bytes from 8.8.8.8 icmp_seq=2 ttl=115 time=4.189 ms 84 bytes from 8.8.8.8 icmp_seq=3 ttl=115 time=4.335 ms 84 bytes from 8.8.8.8 icmp_seq=4 ttl=115 time=4.901 ms ^C VPCS> trace 8.8.8.8 trace to 8.8.8.8, 8 hops max, press Ctrl+C to stop 1 30.1.1.1 0.720 ms 0.342 ms 0.297 ms 2 10.1.1.254 4.886 ms 2.755 ms 1.927 ms 3 192.168.10.253 4.773 ms 2.598 ms 2.446 ms 4 202.14.11.193 2.810 ms 2.187 ms 2.950 ms 5 202.14.12.33 3.585 ms 3.912 ms 2.398 ms 6 203.117.190.81 3.007 ms 3.628 ms 3.860 ms 7 * * * 8 203.118.60.86 3.371 ms 3.265 ms 3.244 ms VPCS> |
지금까지 [2025][Juniper SRX #21] ip monitor - ip sla 글을 읽어주셔서 감사합니다.
'JUNIPER > SRX 방화벽' 카테고리의 다른 글
| [2025][Juniper SRX #23] site to site vpn - S2S VPN - static route (0) | 2025.02.07 |
|---|---|
| [2025][Juniper SRX #22] site to site vpn - S2S VPN - 기본 설정 (0) | 2025.02.07 |
| [2024][Juniper SRX #20] License Install - J-Web (0) | 2025.02.05 |
| [2024][Juniper SRX #19] J-Web (0) | 2025.02.05 |
| [2024][Juniper SRX #18] Firmware recommendation (0) | 2025.01.11 |